Statistics reports provide valuable data about Bandwidth Manager operation.
It will show you total time usage, bandwidth, number of logins for selected day or time period.
Statistical data is collected continuously, after each customer logout, so you can always enjoy fast report display on the screen.
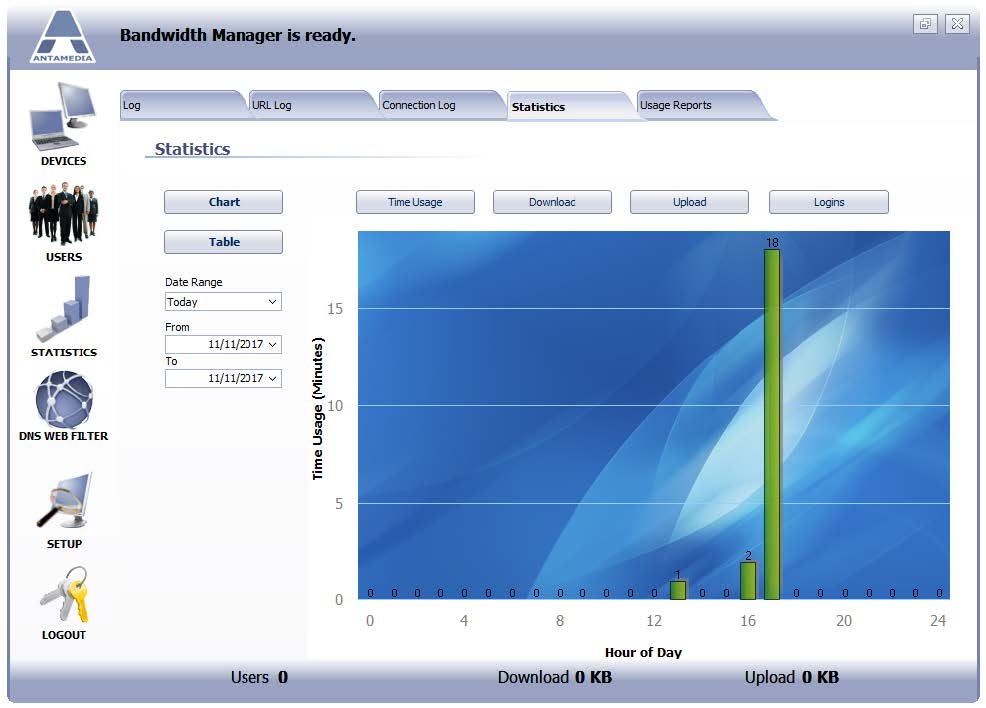
Statistics are available in Chart and Table mode.
By default, statistics are displayed in Chart mode, giving you a graphical overview of Bandwidth Manager activity.
You can see, for example, time usage displayed in minutes, over the selected period displayed as days of the year.
Depending on the date range selected, you will see activity in 24 hours for the current day, or for a time period defined with the starting and the ending date in the From and To fields.
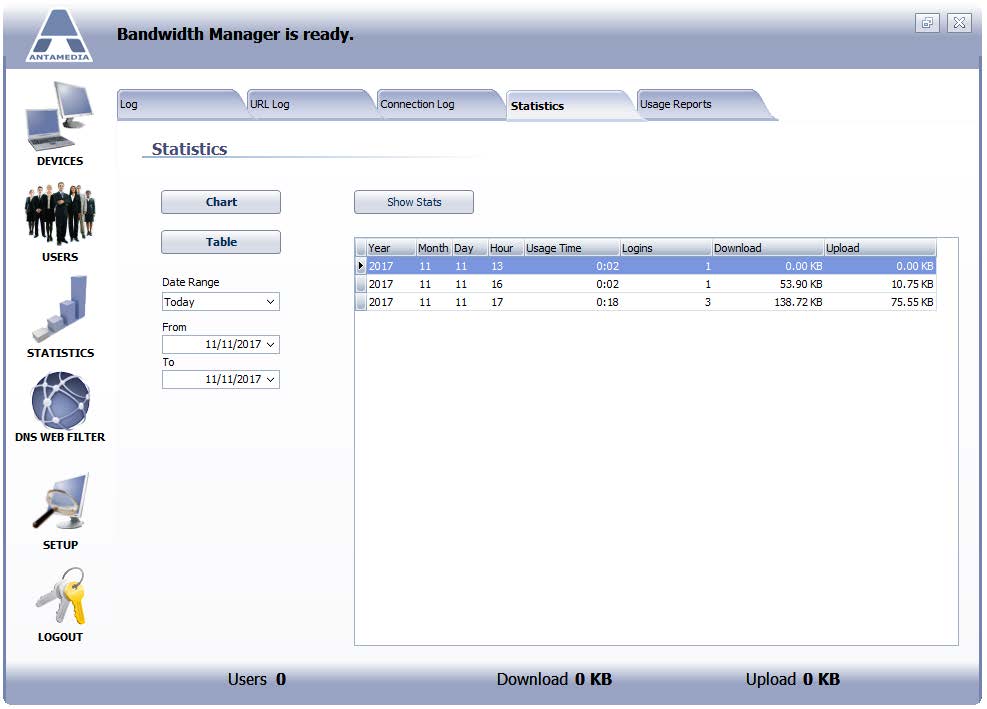
Table mode shows statistics in a condensed view on a daily basis.
For each year, month, and day, you will see usage time, a number of logins, download, and upload.