The Application statistics page contains several types of reports related to application usage.
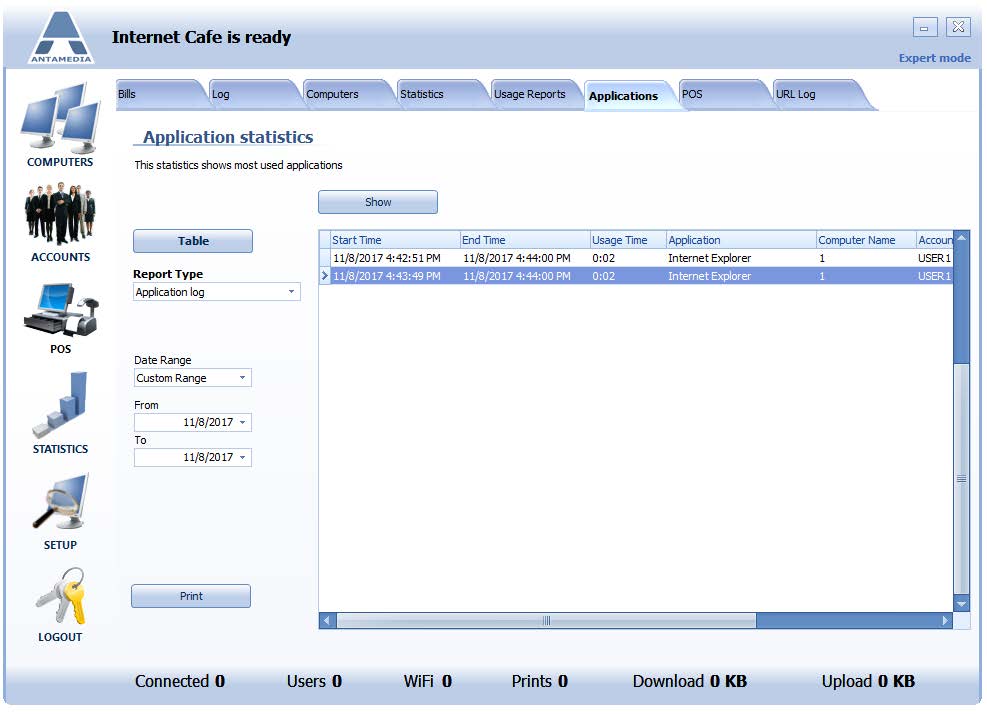
Application log – Application usage report, shows which application was used on
which computer and how long
Top application – summary – Shows percentage distribution of most used applications in a table or pie-chart form
Top application – date range – Shows percentage distribution of the most used applications for a specified date range
All applications – by an hour of the day – This report shows all used applications in chronological order
Top computer – summary – Shows a list of most used computers
Top computer – date range – Shows a list of most used computers for a specified date range
All computers – by an hour of the day – This report shows all computer usage in chronological order
Summary per Account, IP, MAC – Shows total usage time for selected account or computer