From Statistics Dashboard in a single click, you can get an overview of all important statistic details like the number of Total Accounts, Total Bandwidth, Total Time, Total Payment, Total Sessions, Average time and Average bandwidth.
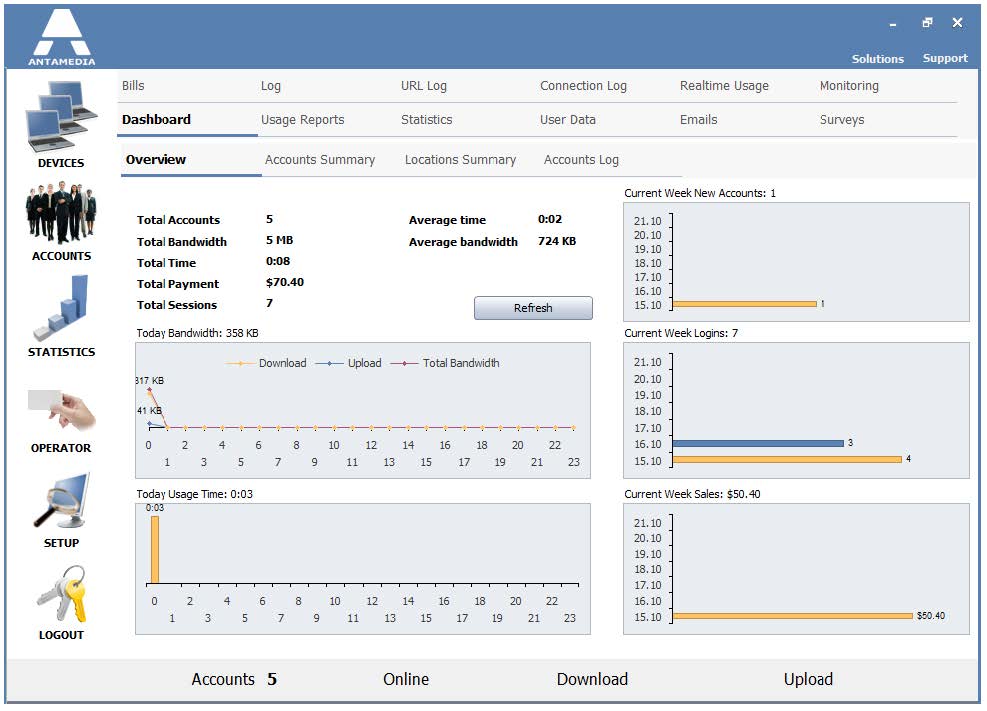
On same page diagrams show Today Bandwidth, Today Usage Time, Current Week New Accounts, Current Week Logins and Current Week Sales.
Accounts Summary
Accounts Summary provides a preview of all account-based database actions.
Press Show button to load Summery and press Print to get a print preview of the summary.
The summary provides information about Account/Action, Usage Time, Logins, Download, Upload, Bandwidth, Sales, Creation Date, First Used and Last Used.
Location Summary
From Location Summary, you have summary results that can be filtered based on WiFi Locations configuration.
The summary contains information based on WiFi location, Total Time, Total Sessions, Total Downloads, Total Uploads, Average time and Average bandwidth.
Accounts Log
Accounts Log give information and reports regarding all Accounts actions and activity.
To display the report for the specified time period, please select the starting and the ending date in the From and To fields, or choose one of the predefined time periods (Today, Yesterday, Last 7 days, etc.), and press the Show button.
You can Filter By Account or Show only new accounts in the date range.
From Report type select between available views: Accounts Log, Top accounts by total bandwidth, Top accounts by time usage, Top accounts by sales, and Top accounts by a number of sessions.
Report details are Account/ Action, WiFi Location, IP, MAC, Start time, End time, Usage time, Download, Upload, Total Bandwidth, Logins, OS, and Sales.